infx contains a status monitor, that will provide the real time state of an instance. It doesn't record any history, or send any notifications.
If, for example, you want to be notified when there is a problem, you need to use a third party monitoring tool. infx provides the status information about informix, and the monitoring tool records the history and sends notifications etc.
The purpose of this post is to describe the process of integrating the infx status monitor with another monitoring tool, in this case nagios.
overview
- set up infx server with nagios user and plug in
- create the check_infx command to output the host status
- set up nagios sudo permissions for check_infx command
- define the infx service check in nagios
- restart the nagios service
nagios core
nagios is a powerful monitoring system that allows you to monitor multiple hosts and set up alerts, actions and escalations for problems. It has many powerful features, different front ends and add-ons.
nagios core is the basic version, with a basic interface. This is available for free, with paid support options. There is also a large community of users for support, as well as providing free front-end tools and add-ons.
There are other editions of nagios are available. See www.nagios.com for more details.
nagios with infx
The infx all command can be used to sum up the overall status of a host. This command applies criteria to each Informix instance on the host to determine a status. Each instance status is then combined to produce an overall host status.
If any Informix instance is warning, then the overall status will be warning. If any are error, then the overall status will be error. Otherwise the status is good.
nagios needs a command that produces one line of output that defines the current status. If this overall status is good, the command returns a 0 exit code. Codes of 1 and 2 are used for warnings and errors respectively.
The first step is to create a template to define the output format, and then create a command to act as a plug-in and execute it.
define template output
I use an infx template file to format the status information as required.
For example, create the file /infx/local/template/nagios.htmlt
<TMPL_VAR NAME=HOST_STATUS> <TMPL_VAR NAME=HOST_STATUS_REASON><br>
plug-in command
I created the following shell script called check_infx, this will perform the check and format the output. The steps involved are:
- executes the infx all command with the nagios template
- translates status e.g. good = ok, warn = warning
- outputs status information
- exits with appropriate code
code
#! /bin/sh

# determine location of infx software
if [ -z "$INFX" ] ; then
        for dir in /infx /usr/local/infx /home/informix/infx ; do
                if [ -e $dir ] ; then
                        INFX=$dir
                        break
                fi
        done
fi

# get the status information and reformat for nagios
out=`$INFX/scripts/infx all util=nagios | sed -e "s/good/ok/g" -e "s/warn/warning/g"`
status=`echo $out | cut -d' ' -f1 | tr '[a-z]' '[A-Z]'`
status_reason=`echo $out | cut -d' ' -f2-`
echo "INFX $status -- $status_reason"

# determine the correct exit code for this status
case "$status" in
    OK)
        stat=0
        ;;
    WARNING)
        stat=1
        ;;
    ERROR)
        stat=2
        ;;
    *)
        stat=3
        ;;
esac

# return exit code to nagios
exit $stat
For script code without formatting, click here: check_infx
Note: the infx all command automatically looks under /infx/local/template for templates. You could also locate the template in any sub directory of that tree.
Locate this check_infx command under /home/informix/bin. Be sure to set permissions 755 so that no-one but informix can edit the file, but so that others can execute it.
This command must be executed as the informix user, so we will have to set up sudo to allow the nagios user to execute this command as informix.
setup nagios user
If you have not already set up nagios server monitoring, you will need to create a nagios user and group. set the users home directory to /home/nagios.
To allow nagios to execute the check_infx command as the informix user, add the following to the /etc/sudoers file.
nagios ALL=(informix) NOPASSWD: /home/informix/bin/check_infx
This needs to be done on all servers hosting Informix instances you want to monitor through nagios.
setup nagios config
Perform the following change to your nagios config.
host group
Define a host group for infx servers.
To enable the infx check for a host, you add it the members list of this hostgroup.
define hostgroup {
        hostgroup_name  infx-servers
        alias           Check infx over SSH
        members         bobii     # <-- added our server here
}
nagios service
We define a nagios service for the the check_infx command.
define service{
    hostgroup_name        infx-servers
    service_description   infx
    check_command         check_infx
    max_check_attempts    4
    normal_check_interval 60
    retry_check_interval  1
}
max_check_attempts - specifies the number of times nagios will retry the command. If the state stays the same each time, then nagios will consider that state "hard" and send a notification.
retry_check_interval - specifies how many minutes to wait between re-checks of the service, before setting the "hard" state.
normal_check_interval - specifies how many minutes to wait between status checks. I would suggest fifteen minutes to one hour depending on the host.
With the above settings, nagios will check the infx status each hour. If it has changed, e.g. from ok to critical, nagios will retry the check up to four times, waiting a minute each time. If the status remains critical, then the state is set as "hard" and a notification will be sent.
This helps prevent excessive notifications and notifications for transient conditions.
nagios command
Finally, we define the actual command to be executed that performs the check.
define command{
    command_name    check_infx
    command_line    $USER1$/check_by_ssh -H $HOSTADDRESS$ -C "/usr/bin/sudo -u informix
                                 /home/informix/bin/check_infx"
}
restart
Now we restart nagios, and this will enable the check.
Here is a screen shot of nagios showing the infx status, along with the other standard Linux server checks.
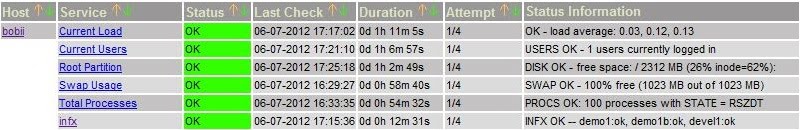
The status information includes the status of each of the three Informix instances on the bobii server.
Summary
Together, nagios core and infx provide a no cost option for centralized monitoring of informix instances.
Once a server has infx installed and is set up under nagios, this command will automatically include all the Informix instances on the host.
You can exclude instances from the check, as well as excluding components of the check. For example, to ignore the backup status check result for an instance, or ignore the instance altogether.
infx controls the settings and thresholds that trigger the warning or error status. Nagios controls the notifications, who receives them, when to notify, when to escalate etc.
See status monitor for more information on the infx status monitor.
For details on how to exclude instances or change the alert levels and settings, see sub-infx-alert.ini.
This provides the basic monitoring of all instances on a host. More detailed instance monitoring can be performed, that will be the subject of future posts.
No comments:
Post a Comment